Overview of VistaVision
VistaVision is a complete software package for confocal microscopy applications including instrument control, data acquisition and data processing. Easy to use, the software has been developed in modular components that can be activated when a specific instrument configuration is selected. The modules include:
- FLIM/PLIM Imaging
- FFS
- smFRET
- Particle Tracking
The Instrument Control module includes the commands for instrument automation control; imaging devices (galvo-mirrors, piezo-controlled stages; stepper-motor controlled stages); laser launcher (laser intensity, laser modulation); and microscope control.
The Imaging module for image acquisition, processing and display allows for the user to acquire single-point data (intensity, kinetics, polarization, lifetime); line data; and images. The user interface includes the acquisition parameters setting (pixel dwell time, image size and resolution) and the image type selection (polarization, FLIM, N&B, RICS). Images stacks are acquired in different axial directions (XYZ, XZY) as well as time series (t, Xt, XYt, XZt).
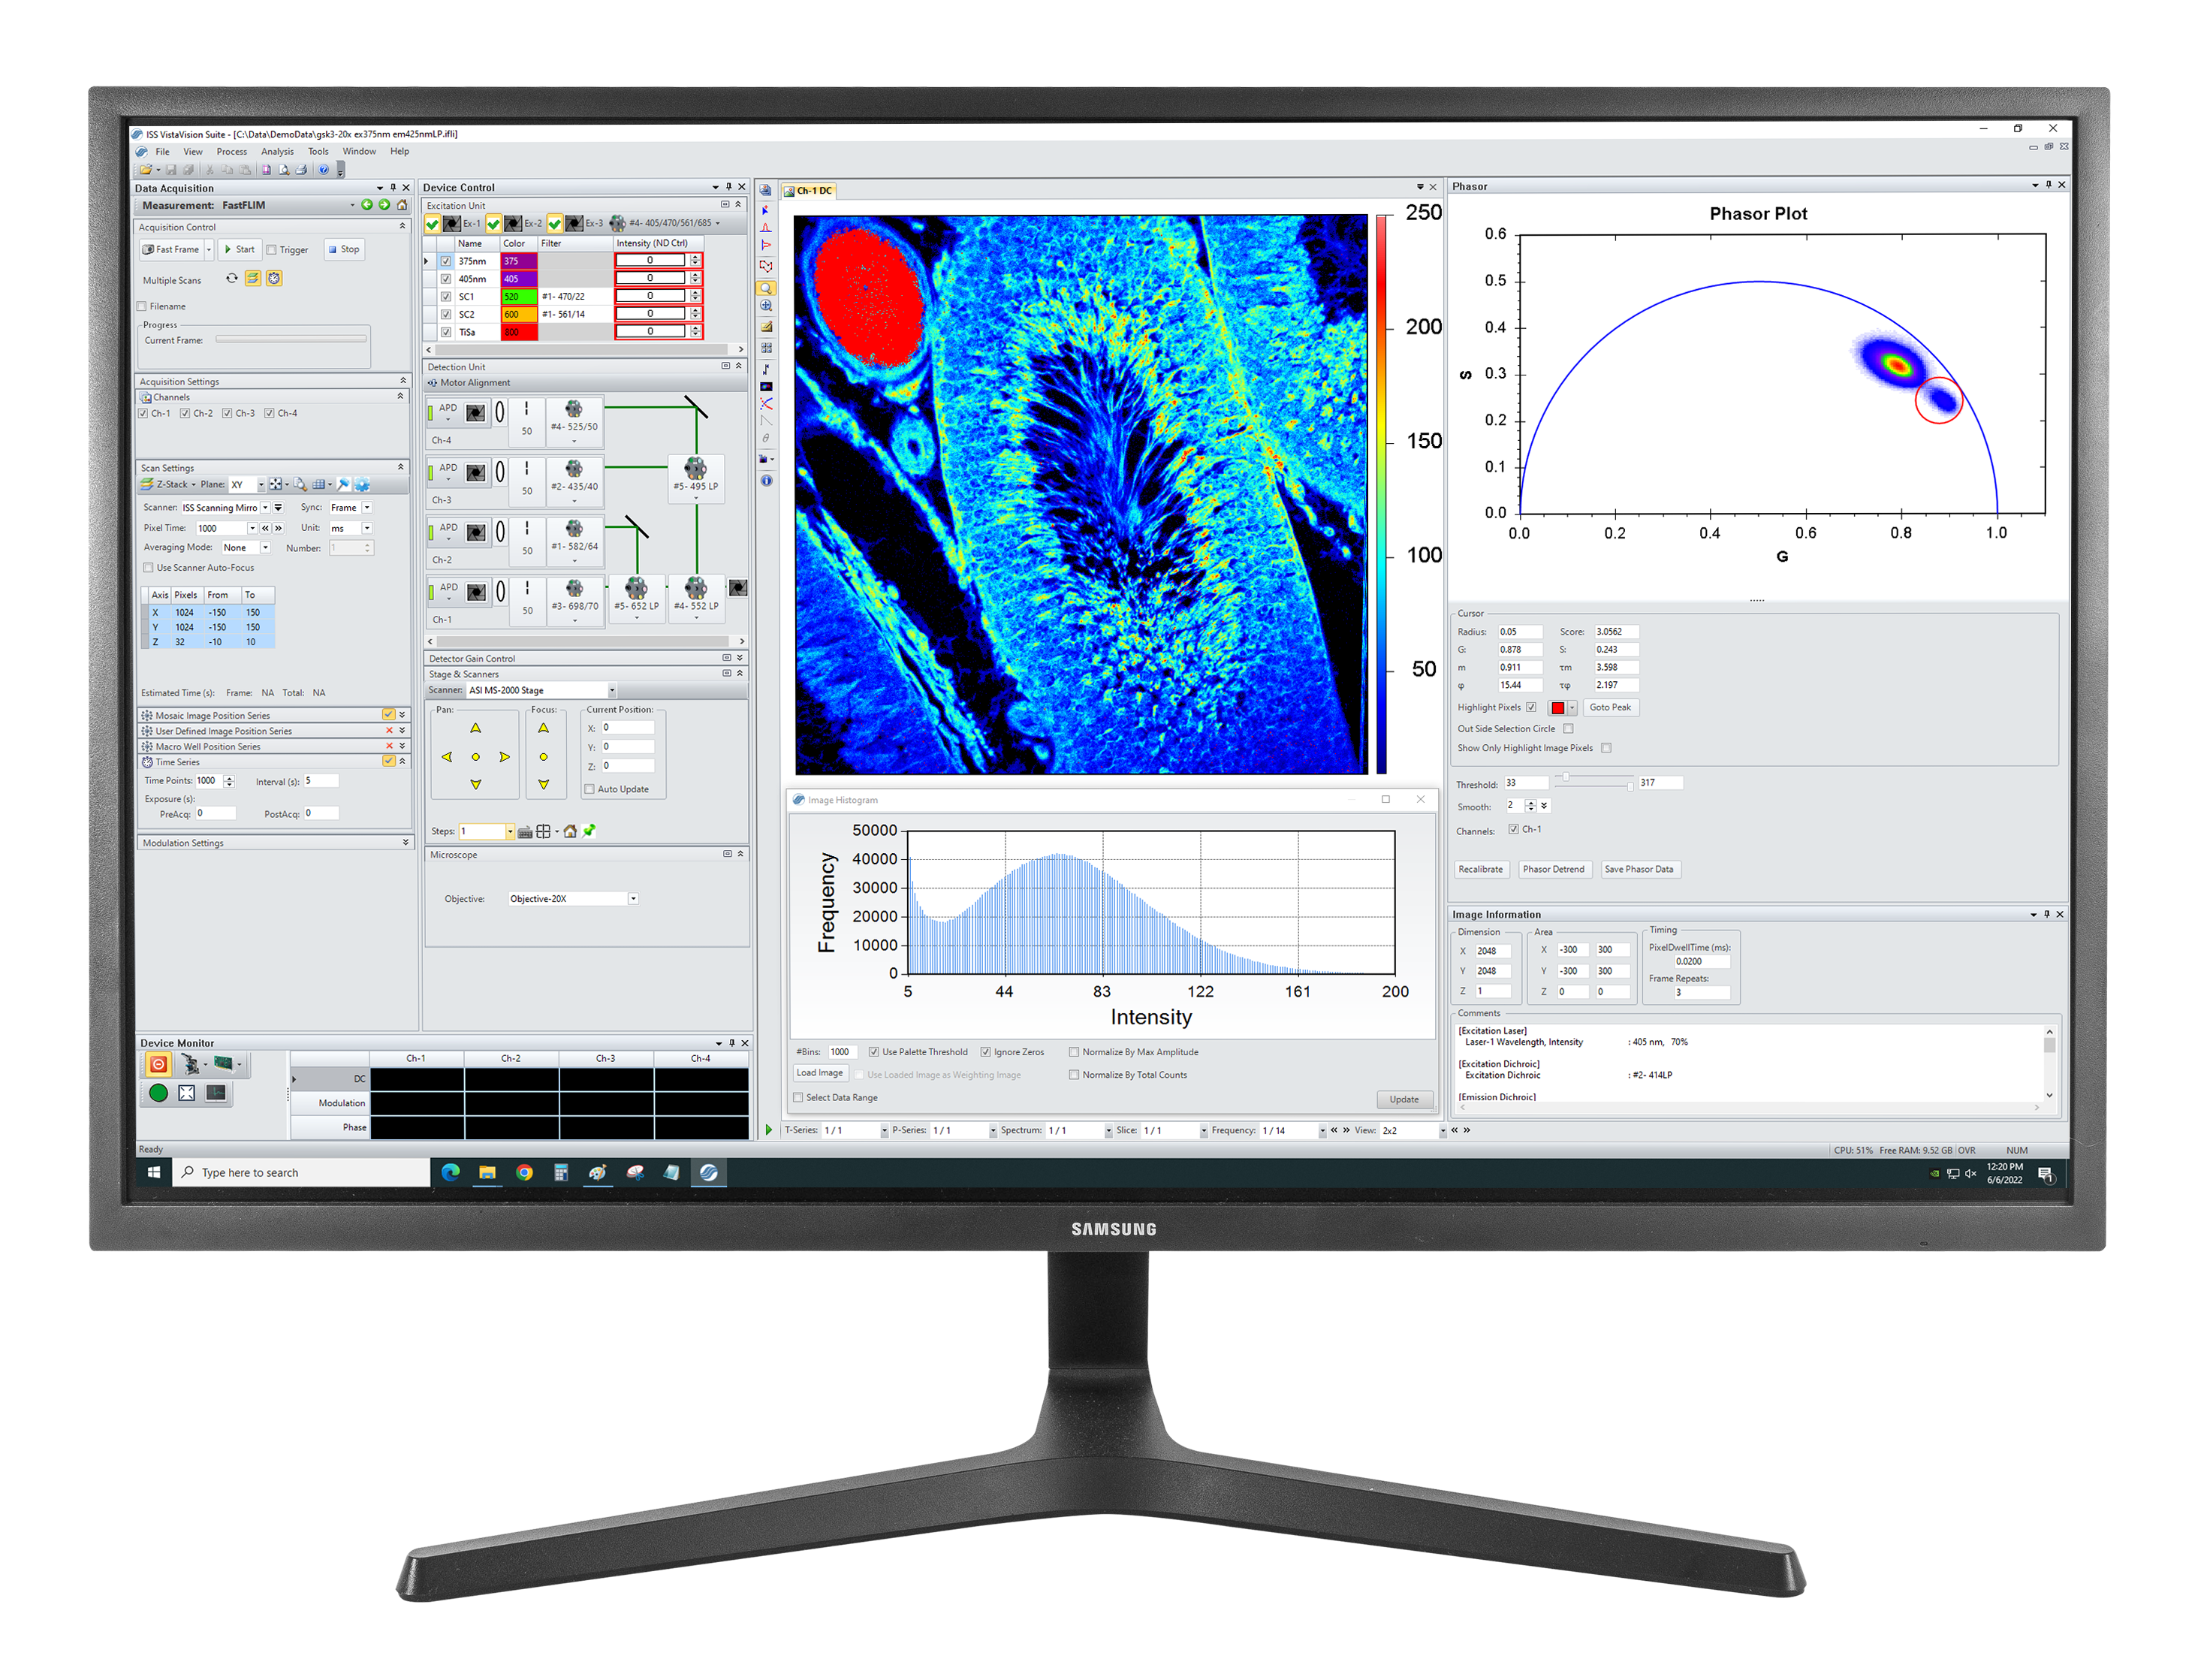
FLIM images are acquired using one of two modalities, either the frequency-domain (DFD) technique or time-domain (TCSPC). FLIM data are processed using the minimization technique (Marquardt-Levenberg algorithm) and the phasor plots. Data are exposed as lifetime images, images of pre-exponential factors and of fractional contributions, when multiple components are present.
The software includes operations between images, smoothing, filtering, rotation, zooming, scaling and automatic threshold setting for image contrast enhancement. Images can be exported to ImageJ and plots are exported to popular formats (png, jpeg, gif, tiff, bitmap, metafile). Movies are produced in avi format.
The FFS module includes routines for FFS data acquisition (FCS, FCCS, PCH, scanning FCS, RICS, N&B). Analysis is performed using autocorrelation function (FCS), cross-correlation function (FCCS) or photon counting histogram.
Custom model functions can be generated by the user and fitted by the software for single point FCS. Multiple files can be analyzed using global analysis with either autocorrelation functions or photon counting histograms. Plots are exported to popular formats (png, jpeg, gif, tiff, bitmap, metafile).
The smFRET module includes routines specifically designed for the FRET determination of pairs of molecules, burst analysis and antibunching. Single molecule FRET data can be analyzed to reveal single molecule events over long period of time, for example, 10 minutes to hours, count the single molecule events, determine FRET efficiency, calculate FRET pair distance distribution. The fitting algorithm uses the Maximum Likelihood Estimator to find the fitting parameters related to photon arrival times from Donor and Acceptor.
The Particle Tracking module enables the reconstruction of a particle trajectory in a medium.
Product Specifications for VistaVision
Instrument Control module
- Control of galvanometer scanning mirrors scanning rate; stage parameters; lasers intensity and activation.
Image acquisition
- Selection of pixel dwell time, image size, image resolution
Image processing
- Operations between images, smoothing, filtering, contrast enhancement
FLIM processing
- Lifetime fitting (Marquardt-Levenberg algorithm)
- Phasor plots
FLIM display
- Lifetime image
- Fractional contribution image
- Pre-exponential factors image
Plots export format
- gif, tiff, jpeg, png, bmp, metafile
Movies export format
- avi
FFS module analysis
- Fitting models for FCS, PCH, FCCS provide:
- Diffusion coefficient, concentration, triplet state, flow rate, size of excitation volume
- Global analysis fitting of up to 120 files
- User defined equation analysis
smFRET module
- FRET determination of pairs of molecules
- Burst analysis
- Fitting algorithm using Maximum Likelihood Estimator
Instrument Control Module
The VistaVision configuration file allows the user to select the proper driver for a variety of components.
Data Acquisition Cards
Scanning Mirrors Modules
- ISS scanning mirrors module
- Cambridge Technology Models
Piezo-controlled Stages
- ISS XYZ piezo-controlled stage
- MadCity Models Nanoposition
- PI Models PiezoNano
- Nanomotion, Model SC-AT
Automated Microscopes
- Nikon Models TE2000-E, Ti-E
Microscopes Stages
- ASI Model 2000
- Prior Scientific Model H117P2IX
Laser Launchers
- ISS Laser Launchers Series
- Intensity control unit for Ti:Sapphire laser
Two-detector unit
- Detector unit including two shutters, two filter wheels and one dichroic wheel used for LSM upgrade packages (Evident (Olympus), Leica, Nikon, Zeiss)
Imaging Module
Data Acquisition
Single point measurements
- Intensity
- Polarization
- Kinetics
- Lifetime
Line Measurements
- Line Acquisition
- Profile Acquisition
Steady-state images (single plan and z-stack)
- Polarization
- Ratiometric
- Kinetics
- Time-lapse Recording
FLIM images (digital frequency-domain) (single plane and z-stack)
- Acquired in digital frequency-domain (DFD). The routine acquires simultaneously a FLIM image and a steady-state image.
FLIM images time-domain (single plane and z-stack)
- Acquired in time-correlated single photon counting (TCSPC)
Raster Image Correlation Spectroscopy (RICS)
- The laser beam acquires an image with a dwell time suitable for the molecular dynamics to be resolved. The technique for measuring molecular dynamics and concentrations from fluorescence confocal images
Scanning FCS (requires FFS module)
- The laser beam rotates on a circle with diameter 100 - 200 nm (user determined) and FFS data are acquired at set angles. At each angle an FCS curve is reconstructed.
Number and Brightness (N&B)
- The laser beam acquires an image with a dwell time suitable for the acquisition of local fluctuations. The measurement provides the presence of clusters and monomers/dimers.
Image Acquisition (Raster Scan)
Min Dwell Time
- 0.2 µs
Pixel Number
- For steady-state images: User selectable from 2 to 4096
- For FLIM images: User selectable from 2 to 2048
Max Line Frequency
- 12 KHz (on 20 points)
Min Line Frequency
- 0.01 Hz
Max Frame Rate
- 512 x 512: 1 s
Beam Park
- The beam can be parked at any position for the acquisition of FFS data
Scan Modes
- For kinetics studies: t, Xt, XYt, XZt, XYZt, XZt
- For optical sectioning: XZ, XYZ
Image Processing and Analysis
Operations on Images
- Scaling
- Arithmetics
- Smoothing
- Zooming
- Rotation
FLIM Processing
- Minimization Technique (Marquardt-Levenberg algorithm)
- Phasor Plots
FLIM Display
- Lifetime Image
- Fractional Contributions Image
- Pre-exponential Factors Image
FLIM images (digital frequency-domain) (single plane and z-stack)
- Acquired in digital frequency-domain (DFD). The routine acquires simultaneously a FLIM image and a steady-state image.
Image Export Format
- ImageJ
Plots Export Format
- gif, tiff, jpeg, png, bmp, metafile
Movies Export Format
- avi
Data File Formats
ifi - 32-bit floating
- Confocal images (steady-state)
- File header includes: image size, pixel time, intensity, etc.
ifli - 32-bit floating
- DFD (FastFLIM)
- AFD (analog FD)
- Includes: DC, phasor, G, S.
- File header includes: image size, pixel time, etc.
- File is already corrected with reference.
fbd - Raw Data (FIFO)
- DFD (FastFLIM)
- No correction applied to the data
- This file is saved simultaneously to the .ifli-format file. No header, image size, pixel time are stored
fbs - Experiment Info
- Header for the fbd-format
- File header includes: image size, dwell time, padding info
spc - Raw Data (FIFO)
- TTTR, time tagged time resolved
- Used with TCSPC
set - Experiment Info
- Header for the spc-format
- File header includes: image size, dwell time, padding info
tif - TIFF tagged images file format
- Confocal images (steady-state)
bin - Binary 16-bit
- LFD image file or FCS in time-mode
- Confocal images (steady-state)
- RICS
int - 32-bit floating
- LFD image file
ref - LFD ref file
- DFD (FastFLIM), 256 x 256 pixels
- Already corrected with reference file
Data File Formats Supported
ref - LFD Reference File
- DFD (FastFLIM), 256 x 256 pixels
- Already corrected with reference file
spc - B&H Format for Raw Data (FIFO)
- TTTR, time tagged time resolved
- Used with TCSPC
set - B&H format for Experiment Info
- Header for the spc-format
- File header includes: image size, dwell time, padding info
FFS Module
Data Acquisition
Autocorrelation (FCS)
- The FCS function gives the temporal correlation of the fluctuations
Cross-correlation (FCCS)
- The FCCS function provides the temporal correlation of the fluctuations related to events occurring simultaneously on two or three channels.
Photon Counting Histogram (PCH)
- The PCH function plots the distribution of the amplitude of the fluctuations.
FFS measurement at target XYZ locations in an image
- The user selects the XYZ locations moving the cursor or entering the values in the software. The laser beam moves sequentially to each location to acquire FFS data that are then analyzed.
FLCS, Fluorescence Lifetime Correlation Spectroscopy
- Using lifetime data (either from TCSPC or frequency domain), the technique allows for the separation of different FCS contributions.
Scanning FCS (requires FFS module)
- The laser beam rotates on a circle with diameter 100 - 200 nm (user determined) and FFS data are acquired at set angles. At each angle an FCS curve is reconstructed.
Data Analysis
| Single set and Global fitting models | Parameters determined |
|---|---|
| Autocorrelation (FCS) and Cross-correlation (FCCS) | |
|
|
| Photon Counting Histogram (PCH) | |
|
|
| User Defined Equation | |
|
|
Data File Formats
fcs - Binary Format
- FFS raw data file
csv - ASCII Format
- FCS
- Correlation and autocorrelation function
hst - ASCII Format (csv)
- PCH - Photon Counting Histogram
nts - Text File
- Notes on FFS files
Data Acquisition
Recording single molecule events
- from 0 up to hours
Data Analysis
FRET pair distance distribution determination & FRET efficiency
- The fitting algorithm uses the Maximum Likelihood Estimator