Overview of Vinci
A comprehensive multidimensional fluorescence spectroscopy software program designed to enhance the capabilities and performance of ISS spectrofluorometers.
Compatible with ChronosBH, ChronosDFD, and PC1.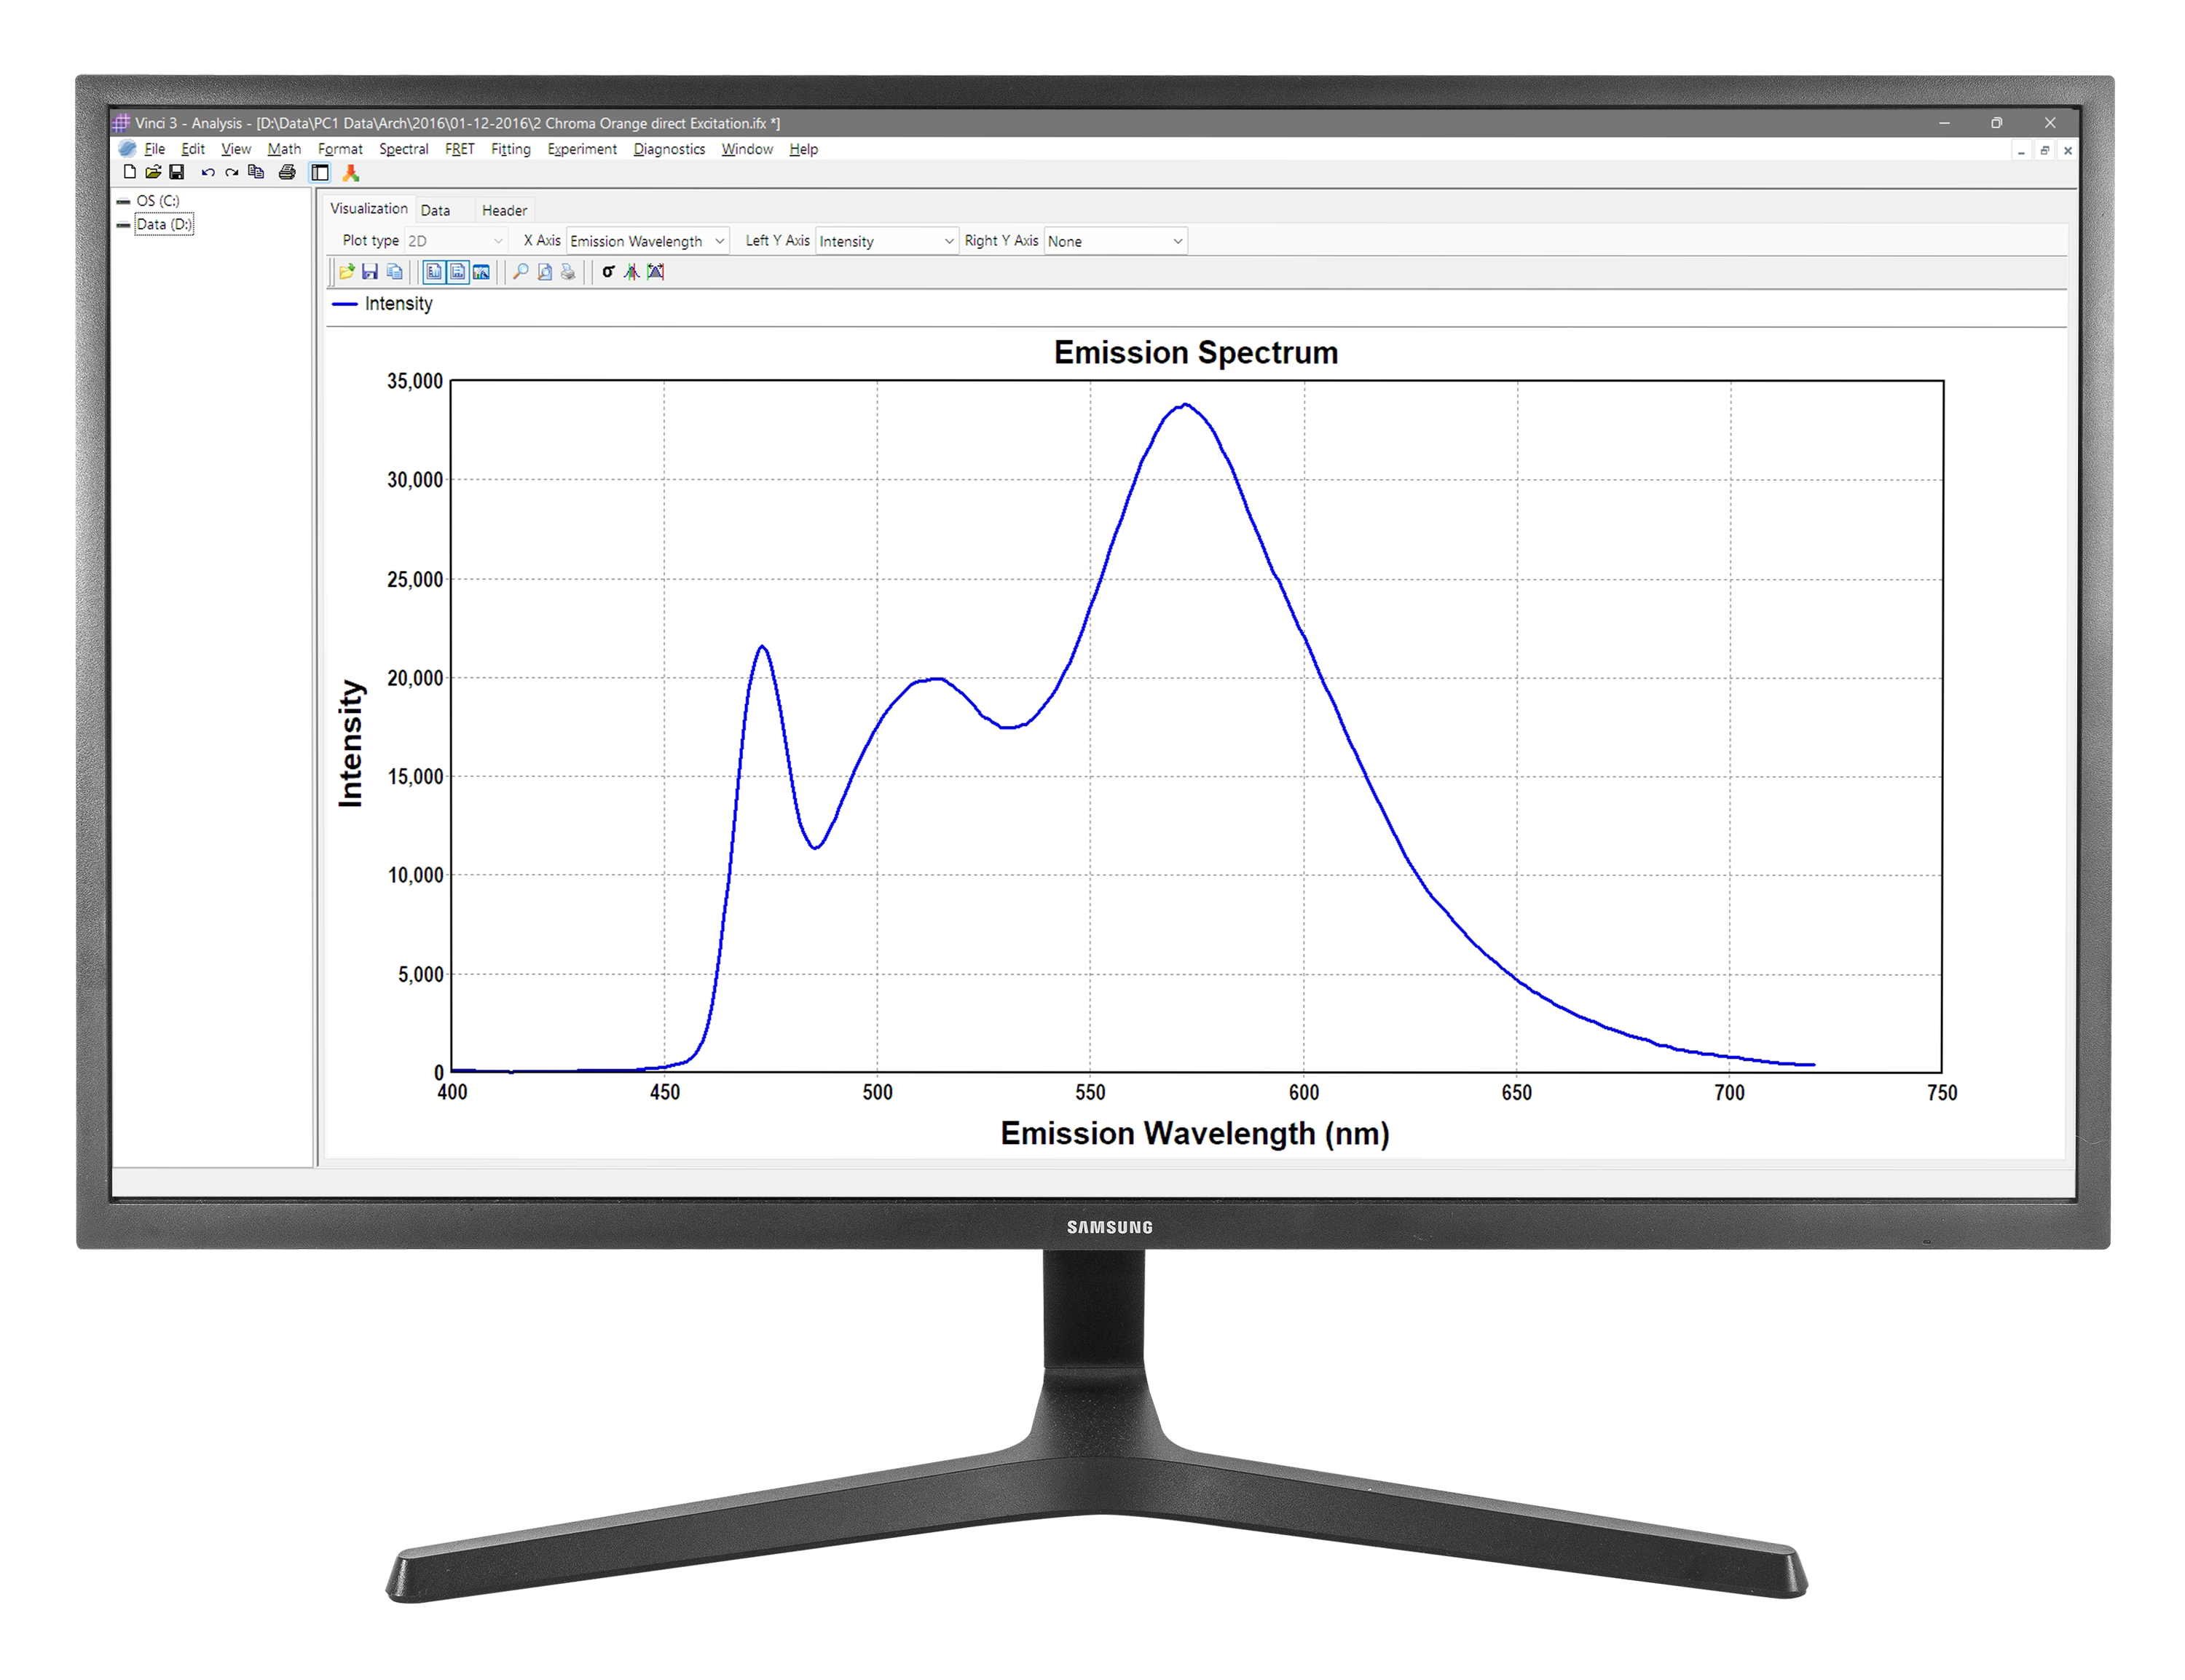
Vinci offers unparalled performance to the end-user through three distinct features
Instrument Control
Vinci provides full control of all the automated instrument components, including shutters, polarizers, sample holders, monochromators, and enables the integration of external devices such as stopped-flow apparatus, titrator, and temperature bath. Vinci's remote interface allows ISS Support Personnel to access any instrument in the world via internet and conduct a remote diagnostic check-up.
Data Acquisition
Vinci offers a variety of data acquisition options (spectra, lifetime, kinetics, titrations) through built-in, easy-to-use, routines and allows the user to generate, store and rerun custom-designed data acquisition protocols. Data are stored in ASCII format for convenient access from other software packages.
Data Analysis
Vinci's fast fitting routines allow the user to retrieve multiple decay times and rotational correlation times, to obtain time-resolved spectra with picosecond resolution and to separate steady-state spectra of up to three components in a mixture using the phase- and modulation-resolved spectra measurement option. Other operations include smoothing, derivative, calculation of area and arithmetic between files. A superb graphical interface generates and displays 2D and 3D plots that can be exported in presentation-ready formats. A report can be saved in Word or PDF format.
Product Specifications for Vinci
Instrument Control
- Automation of ISS instrument components
- Control of external devices
- Temperature bath (Neslab, Fisher)
- Titrator (ISS, Hamilton)
- Stopped-flow apparatus (Molecular Kinetics, OLIS, Hi-Tech, Applied Photophysics, Kintek)
- Pressure pump
- Recording from temperature/pressure sensors
- Storage of all experimental parameters in the experiment data file
One-dimensional measurements
- Corrected Excitations and emission spectra
- Excitation-Emission matrices
- Polarization/Anisotropy
- Kinetics (slow, fast)
- Titrations
- Fluorescence decay times (exponential and non-exponential)
- Rotational correlation times (isotropic, anisotropic, hindered)
- Time-resolved spectra
- Phase- and modulation-resolved spectra
Multi-dimensional measurements
The user can select from any of the following experimental combinations
| Fluorescence Intensity Polarization/Anisotropy Ratiometric Measurements |
vs. | Excitation (Emission) Wavelength and/or any of the following:
|
| Fluorescence Intensity Polarization/Anisotropy Ratiometric Measurements |
vs. | Time and/or any of the following:
|
| Phase and Modulation Differential Polarization |
vs. | Modulation Frequency and/or any of the following:
|
User defined protocols
- The user can define protocols for both one-dimensional and multi-dimensional measurements. Protocols can be stored and rerun.
Spectral Analysis
- Normalization
- Smoothing (average, median, Savitzky-Golay)
- Derivative (nth-order)
- Integration (area, average and standard deviation)
- Spectral correction
- Spectral moments
- Conversion to wave numbers
- Data Interpolation
- User-defined filtering
- Fitting to user-defined model
Spectral Operations
- Addition, subtraction, multiplication, division
- Scaling factor
Time-Resolved Analysis
- Multiple decays for up to 4 components for exponential, non exponential and lifetime distributions
- Rotational correlation times for isotropic, anisotropic and hindered rotators
- User-defined models
- Phase- and modulation-resolved spectra
- Time-resolved spectra
Simulation
- Phase and demodulation versus modulation frequency for up to 4 components for exponential, non exponential and lifetime distributions
- Differential phase and modulation ration versus modulation frequency for isotropic, anisotropic and hindered rotators
Display
- 2D and 3D display with user-defined colors and fonts
- 3D surface rotation and in/out zooming
- Cursor identification of XY spectra coordinates
Data Format
- The data files are stored in an accessible text (ASCII) format.
- The experiment data file, or raw data file, includes the information about the experiment protocol and, as such, it can be re-loaded to rerun the original experiment.
- Experiment data files cannot be overwritten; once an experiment data file is modified, the new file is stored as analysis data file. Experiment files and Analysis files are identifiable through their different extensions and icons.
Data and Plots Export
- Plots export to gif, tiff, jpeg, png, bitmaps and metafiles
- Compatible with LFD and CFS formats
Links
- To Global Analysis by Globals Unlimited
- To DATAN by MultiD Analysis AB
Import
- ISS (cat, lif, pol), LFD, SLM
Operating System Supported
- Windows 11